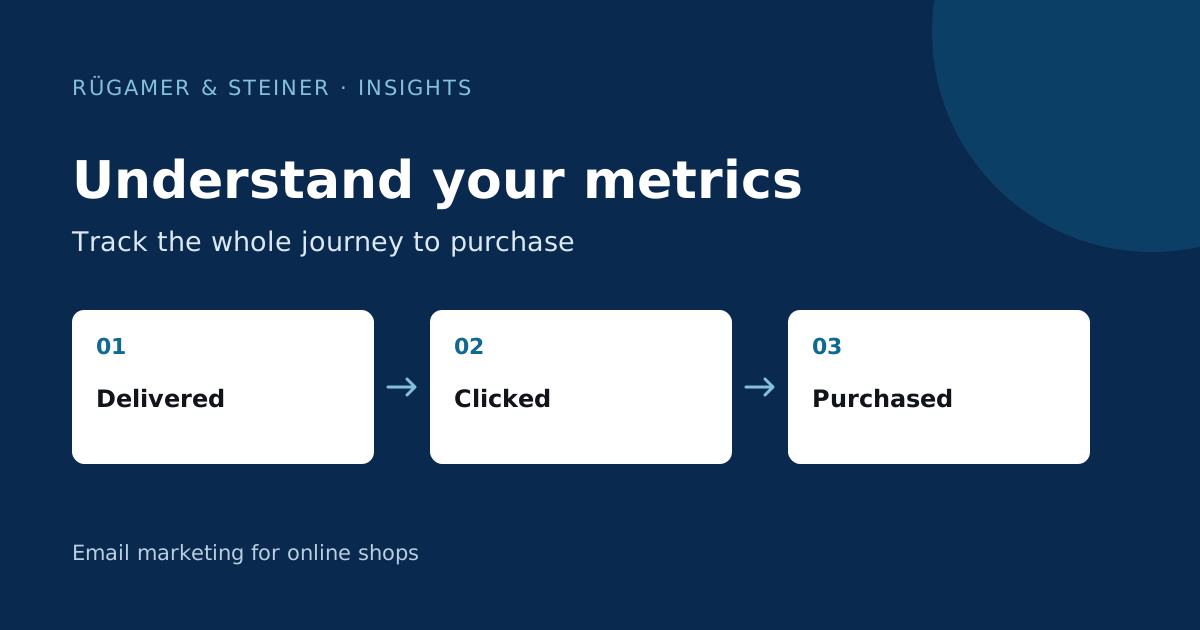
At a glance
For a meaningful comparison, you need the same denominator, the same measurement rules and a suitable time period for each metric. Distinguish between individual recipients and multiple clicks. Furthermore, revenue attribution does not show how much additional revenue an email has generated.
Which email marketing KPIs belong in your report?
These working definitions relate to a single email send. Only analyse later orders once the selected attribution window has closed. Your export should make clear which people, events and periods each metric covers.
| Metric | Calculation / Perspective | Interpretation |
|---|---|---|
| Delivery rate | Messages delivered ÷ messages sent × 100 | Technical delivery does not yet guarantee placement in the inbox. |
| Unique click rate | Recipients who clicked ÷ messages delivered × 100 | Each person counts once; automated clicks can skew the figures. |
| Order rate per person | Recipients with at least one attributed order ÷ messages delivered × 100 | A tool can count order events instead. Do not adopt the definition without verification. |
| Revenue per email delivered | Attributed revenue ÷ messages delivered | Helps compare sends of different sizes, but does not account for margin. |
| Unsubscribe rate | Recipients who have unsubscribed ÷ messages delivered × 100 | Review spam complaints alongside unsubscribes. When comparing tools, check that both use the same denominator. |
In a flow comprising several messages, the same person may be contacted multiple times. The number of emails delivered does not, therefore, represent the number of different people. Label the report accordingly, rather than mixing metrics per message and per person.
Worked example: more revenue, less revenue per email
Fictitious figures for illustrative purposes only; not actual customer results: Campaign A is sent 10,000 times and delivered 9,800 times. 294 people click a total of 490 times. 49 recipients are each attributed one order worth €100, giving total attributed revenue of €4,900.
- Delivery rate: 9,800 ÷ 10,000 × 100 = 98 %.
- Unique click rate: 294 ÷ 9,800 × 100 = 3 %.
- Order rate per person: 49 ÷ 9,800 × 100 = 0.5%.
- Revenue per email delivered: €4,900 ÷ 9,800 = €0.50.
If you use ‘all 490 clicks’ instead of ‘294 people’, you get 5 per cent. This describes a different metric: multiple clicks do not turn one person into five interested recipients.
Campaign B has 19,600 delivered emails and €7,840 in attributed revenue. Compared with A, total revenue is up 60 per cent. Per delivered email, however, it is €7,840 ÷ 19,600 = €0.40: 20 per cent less than with A.
The next step would be to examine the differences: Was the additional segment less likely to make a purchase? Did the basket value change? Were there different prices or discounts? The figures show a discrepancy, but not yet a cause. Without comparable recipients and offers, A versus B is not a controlled test either.
Why the open rate alone is not enough
Apple Mail Privacy Protection can preload content and register a technical open without the recipient reading the message. Klaviyo explains how to view these opens in your reports. When protection is active, it is not possible to reliably distinguish between human and automated opening.
You should therefore treat the open rate as a limited indicator. A noticeable change may warrant further investigation, but is not definitive proof of a better subject line. Take clicks, orders and negative reactions into account. Click data also requires an examination of the filters available in the tool for automated activity.
Klaviyo and GA4: different perspectives
Attribution is the rule-based assignment of an order to a touchpoint. For example, a customer might click on a link on Monday and make a purchase on Wednesday. Whether the order is attributed to the email depends, amongst other things, on the configured time window and other interactions taken into account. Klaviyo describes this in the Documentation on conversion measurement.
Google Analytics 4 tracks activities recorded on websites or apps. Differences in identification, recorded events and attribution rules may lead to discrepancies in reports. Klaviyo also explains these differences in its Documentation on UTM tracking. You should therefore first compare the measurement rules rather than automatically dismissing a report as incorrect.
Attributed revenue does not tell you how many orders would not have happened without the email. That requires a suitable comparison, such as a carefully designed experiment with a random control group and enough data. Assess total revenue, discounts and contribution margin alongside it.
Finding newsletters in Google Analytics
UTM parameters identify campaign links. Define a consistent scheme for source, medium and campaign, for example utm_source=newsletter, utm_medium=email and utm_campaign=autumn-collection. This allows visits recorded in this way to be attributed to a campaign. Google describes the parameters and relevant acquisition reports in the Guide to campaign URLs.
Use consistent spelling and documented campaign names. Different capitalisation may result in separate values. Also test whether redirects retain the parameters. Do not include personal recipient data in such link labels. A tagged URL alone does not replace either the configured Analytics tracking or the verification of purchase events.
Frequently asked questions about email metrics
What constitutes a good newsletter click-through rate?
A general target figure does not take into account the industry, target audience, delivery method or measurement definition. Start by comparing similar campaigns of your own. External benchmarks serve as a guide provided the timeframe and methodology are transparent.
How often should the team review the results?
After sending, first check for any technical issues. The content evaluation then requires sufficient time to allow for expected reactions and the measurement window used. Supplement individual campaign analyses with a regular review of longer-term trends.
Sources and further documentation
Product documentation and primary sources relating to the steps described. Editorial source date: 10 September 2026.