At a glance
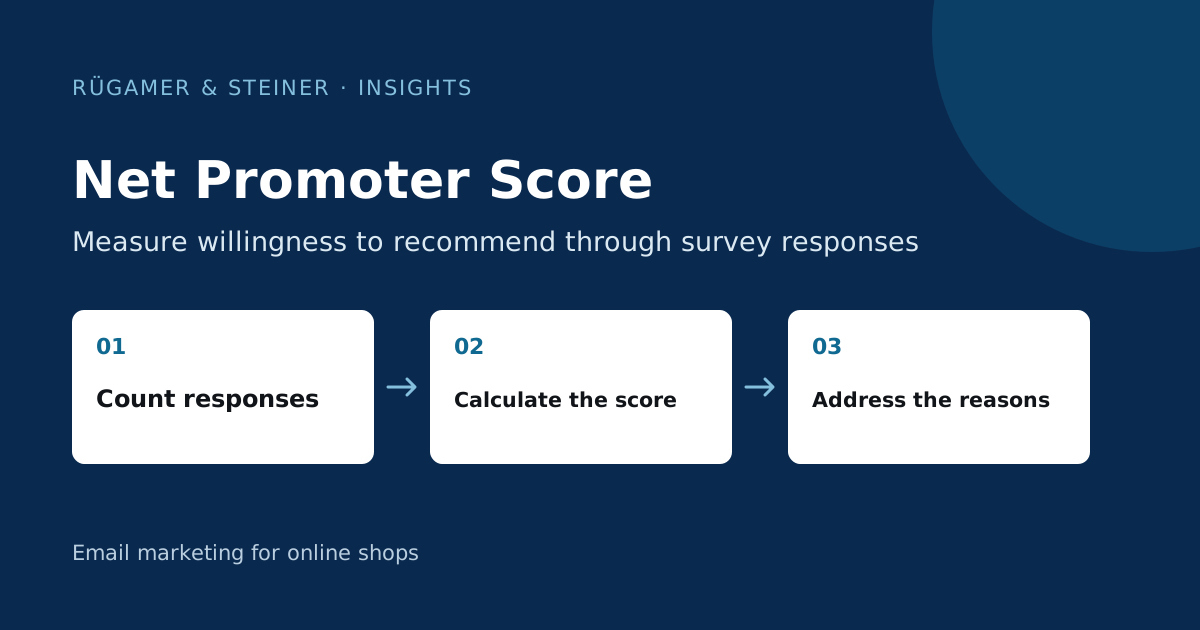
The NPS is the percentage of 9 and 10 ratings minus the percentage of 0 to 6 ratings. Ratings of 7 and 8 remain in the denominator. State the number of responses and the sample of respondents. A positive value does not indicate either a higher repurchase rate or a representative view of all customers.
What does the Net Promoter Score measure?
The Net Promoter Score, or NPS for short, measures the stated willingness to recommend a business on a scale of 0 to 10. The Official description by Bain classifies responses of 9 and 10 as promoters, 7 and 8 as passives, and 0 to 6 as detractors. This measures a stated opinion, not a recommendation that has actually taken place.
For a shop, the context of the survey is crucial. A response after checkout can reflect the ordering process. After delivery, shipping details and first impressions of the product are taken into account. A few weeks later, the customer will be more familiar with the product. Determine which relationship or experience your survey should focus on. Use the same metric for later comparisons; otherwise, the significance of the value will change.
Calculate NPS using a fictional example of your own
The formula is: the proportion of promoters minus the proportion of detractors. For the following arbitrary example, there are 200 valid responses: 110 people give a score of 9 or 10, 40 people give a score of 7 or 8, and 50 people give a score of 0 to 6. The proportion of promoters is 110 divided by 200, i.e. 55 per cent. The proportion of detractors is 25 per cent. The NPS is 55 minus 25, i.e. 30.
The score range is from minus 100 to plus 100. State the score as a numerical value, not as a percentage of satisfied customers. Passive responses are neither added nor subtracted, but remain part of all valid responses. The average of the individual ratings is a different metric. Even ten ratings with an average of eight do not automatically result in the same NPS as one hundred ratings with this average.
Response rate and selection should be included in the report
A second fictional detail: the 200 responses come from 2,000 reachable, suitable respondents. The response rate is therefore ten per cent. The NPS initially describes these respondents. It is possible that particularly satisfied or particularly disappointed customers are more likely to respond. Without further analysis, it cannot be claimed that all other customers would judge the situation in a similar way.
Bain explains in an Article on response bias why survey results may differ from the wider group. Check which customers were invited. A form shown only to regular buyers excludes first-time buyers. Sending only to people who recently clicked an email captures a different group from an independent sample of suitable customers.
Establish a clear survey process
Document the invitation, language, timing and handling of multiple responses. For example, define one valid response per person and survey round. Determine in advance how incomplete forms or test responses will be handled. Do not change the exclusion rule simply because a particular response worsens the result. A returning respondent may change their opinion in a later round; this is an additional observation, not an automatic data error.
Use a neutral invitation and ask for a reason in the customer’s own words. A gift must not be conditional upon the customer leaving a high rating. Test on mobile devices to ensure the entire scale is equally visible and usable. A barely reachable zero or a highlighted ten may influence the response before the customer has even expressed an opinion.
Derive specific tasks from free-form text
Organise recurring notes by clear themes: size selection, delivery information, packaging, usage or service. Count how often a topic appears in the valid responses, and also retain any conflicting feedback. A single, particularly clear comment should not automatically be regarded as the most common problem. Add observable information such as queries or reasons for returns, where this is reliably available.
A specific planning example: Several buyers mention incomprehensible care instructions. The team checks the actual instructions, revises the relevant section and adds a post-purchase email containing the same clear explanation. In the next round, the timing of the survey remains consistent. The topic is monitored in the responses as well as in relevant service enquiries. An increase in the NPS alone cannot yet confirm the cause of the change.
Combining NPS, repeat purchase and customer satisfaction
Compare the score with other metrics rather than using it as the sole key performance indicator. A customer may recommend the brand whilst not currently needing a new product. Another may make regular purchases, even whilst criticising a specific shortcoming. Repeat purchases within a defined time frame, reasons for complaints and returns therefore complement the stated recommendation.
Where possible, compare results using a similar target audience and the same procedure. Always state absolute response figures. With 20 responses, a single person’s different classification will affect the score much more significantly than with 2,000 responses. Small changes warrant cautious interpretation. An industry benchmark from a differently structured survey is not a reliable target for your own shop.
Which checks should be carried out before the first evaluation?
- Use test responses to check how scores of 6, 7, 8 and 9 are classified.
- Count promoters and detractors manually and verify the formula.
- Handle passive, invalid responses and duplicate entries in accordance with the specified rule.
- State the selection criteria, invitation process and observation period in the report.
- Examine response rates and reasons by group, without presenting small groups as representative.
- For each prioritised topic, designate a responsible person and a verifiable action.
Do not automatically publish customer comments with names. A summarised list of topics is often sufficient for internal evaluation. The benefit of the score lies in a transparent learning process: recording feedback, investigating the cause, improving the affected process and monitoring the effect with an appropriate follow-up measurement.
Sources and further documentation
Product documentation and primary sources relating to the steps described. Editorial source date: 5 October 2026.