At a glance
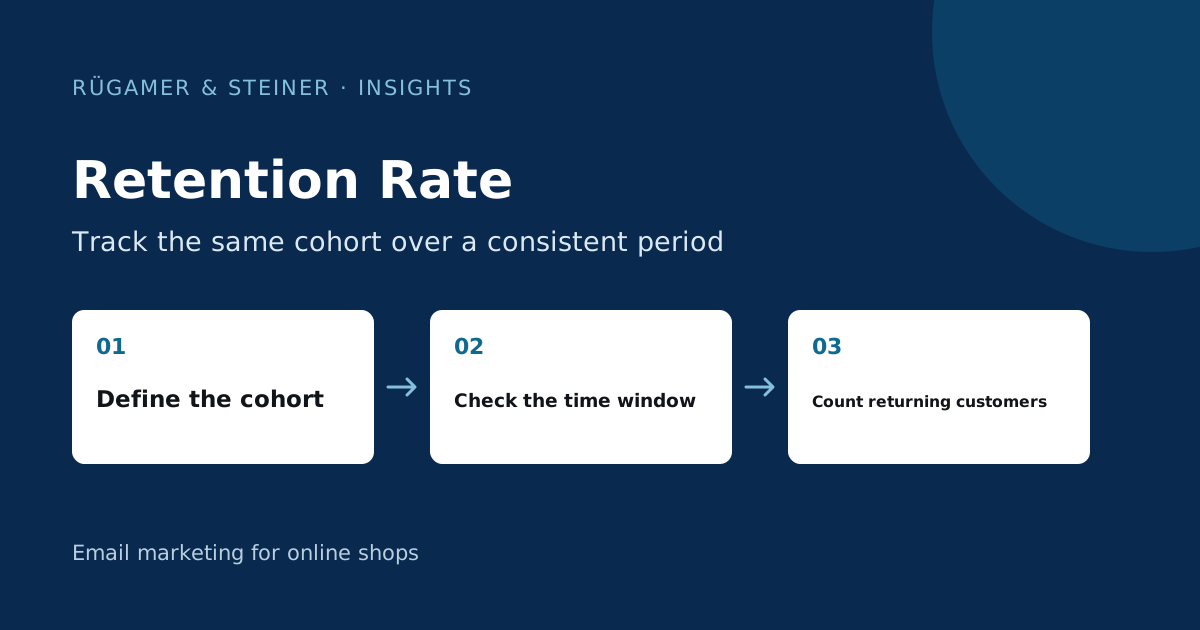
Define the source group, return event and time window before performing the calculation. A repeat purchase rate across the entire history and a return rate within 90 days are different metrics. In e-commerce, first-time buyer cohorts of the same age are often more meaningful than a blanket formula for active contract customers.
What is the retention rate?
Retention rate refers to the proportion of an initial group that remains or becomes active again after a defined period of time, based on a specified criterion. An ongoing contract provides different evidence to a further purchase. A retailer without a subscription must therefore define when a customer relationship is considered active. An email being opened answers this question differently from a valid order.
The repeat purchase rate typically describes the proportion of customers under consideration who have made more than one purchase. Without a time frame, it may include early repeat purchases made several years ago. Therefore, state the full definition, for example: the proportion of first-time buyers in January who placed a second valid order within 90 days. The detailed description makes reports easier to understand than a standalone percentage figure.
Which formula is appropriate for the group in question?
For a fixed cohort, the calculation is: the number of initial customers with the defined return event divided by the total number of customers in the initial cohort, multiplied by 100. Count individuals uniquely and retain the denominator. A customer who makes three further purchases counts as one in this per-person ratio. You can show the number of orders as an additional figure alongside this.
The commonly used formula for calculating customer retention is: customers at the end minus new customers acquired, divided by customers at the start, multiplied by 100. It only applies to a consistently defined active customer base. A hypothetical contract example with 1,000 active customers at the start, 950 at the end and 150 new customers added results in 80 per cent. Do not apply this calculation uncritically to all shop profiles ever created; in such cases, a missed purchase does not constitute a contract that has been definitively terminated.
A fictional example of two different ratios
A hypothetical group of 1,000 first-time buyers makes their first purchase in January. 240 of these people place another order within 90 days of their individual first purchase. The 90-day repeat purchase rate for this cohort is 24 per cent. A second analysis examines who places an order between the tenth and twelfth month after their first purchase: in this example, this applies to 200 people, i.e. 20 per cent of the initial group.
The second figure is a return rate within a later time window. It does not represent a decrease from 24 to 20 per cent within the same measurement period. Both figures relate to different event windows; individuals may appear in both or only one group. Use fixed rules regarding cancellations and refunds. A technically recorded order that is fully reversed should not be tacitly given the same meaning as a retained product.
Using cohorts and segments in Klaviyo
The Klaviyo Guide to Retention Calculation shows a source group of previous buyers and a sub-group that made a subsequent purchase. The time windows can be adapted to the shop. Check whether your group definition actually refers to first-time buyers or all buyers within a given period. These groups do not need to be the same size or have the same purchase history.
The Guide to cohort analysis explains the analysis of a group over subsequent months and the comparison of groups of the same age. Do not add monthly rates to the total number of returning customers. A person may make purchases in several months. To calculate a cumulative rate per person, you need uniquely counted returning customers within the entire time frame.
Fair comparisons take time and context
Only compare a new monthly cohort over a 90-day period once all members under consideration have passed through this window. Otherwise, the most recent buyers will not yet have had the same opportunity to return. Clearly state the observation period. Comparing cohorts after their first, third or sixth month allows you to track different stages of maturity.
Also check the product range, seasonal promotions and first-purchase discounts. A gift bought during the Christmas shopping season creates a different reason for repeat purchase than food that is needed on a regular basis. An overall lower rate may result from a change in the customer mix. You should therefore compare meaningful sub-groups without subsequently cherry-picking only the favourable-looking results. With a small number of customers, random fluctuations are particularly noticeable.
Turn a metric into a concrete next step
A low return rate initially indicates that, within your definition, fewer people returned. It does not yet identify a cause. Check for typical obstacles: correct usage, expected shelf life, delivery issues, a lack of suitable products or unclear re-ordering procedures. Enquiries to customer service and a review of order data can help to refine a hypothesis before launching a new email campaign.
A hypothetical planning example: if a consumable product is typically used up after eight weeks, a clear re-order guide may be useful. For a durable purchase, a product care email might be more appropriate. In addition to repeat purchases, measure unsubscribes, complaints and the economic contribution. An additional order with a high discount is not sufficient evidence of an improved customer relationship.
Set up a reproducible retention test
- Document the starting cohort, purchase dates, product context and original customer count.
- Define return event, observation period, cancellations and refunds.
- Tracking one-time, repeat and non-repeat buyers in a small sample.
- Distinguish between the number of people and the number of orders.
- Clearly state the timeframe and maturity level in the report.
- Retain the same definitions for the next comparison.
Save a dated snapshot of the analysis rather than relying only on a dynamic segment. This helps explain figures that change later. Include the data source and any known gaps. Another team member can then recalculate the rate and assess whether a change relates to the original objective.
Sources and further documentation
Product documentation and primary sources relating to the steps described. Editorial source date: 5 October 2026.