At a glance
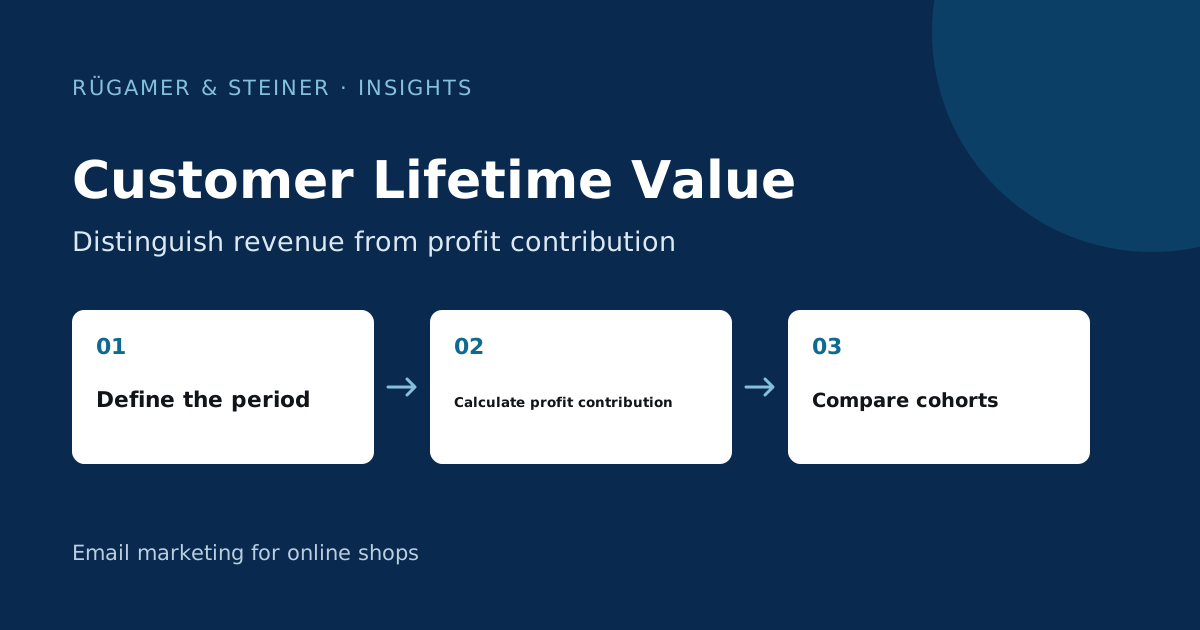
Define customer lifetime value (CLV) as observed revenue or as a contribution after specific costs, and specify the time period. Compare first-time buyer cohorts with the same amount of follow-up time. Klaviyo’s Historic, Predicted and Total CLV are product metrics with their own rules; they do not replace margin calculations and are no guarantee of the next purchase.
What does Customer Lifetime Value mean?
Customer Lifetime Value, or CLV for short, describes the value of a customer relationship over its duration. For practical analysis, the term requires greater precision: does it refer to order values to date, a defined period, or expected future contributions? Write this definition alongside the metric. Measured revenue over the first twelve months is a useful indicator, but does not yet constitute a fully observed lifetime value.
When making decisions about marketing budgets, it is also important to consider what remains after the relevant costs have been deducted. Both a revenue-based figure and a value based on the contribution margin can be useful. They answer different questions. Therefore, present them as separate columns. A high purchase frequency can be economically disappointing if each additional order contributes only a small amount due to discounts, delivery costs or returns.
A sample calculation using fictitious figures
The following figures are arbitrary example data, not a client reference: a group of 1,000 first-time buyers generates 3,000 orders within twelve months, with an average net sales value of 60 euros after discounts and refunds. The observed revenue amounts to 180,000 euros. In this example, the cost of goods sold is 99,000 euros, with a further 24,000 euros in variable costs for payment, dispatch and processing.
This leaves a contribution of 57,000 euros before the acquisition costs, which are considered separately: 180,000 minus 99,000 minus 24,000. That amounts to 57 euros per original first-time buyer. With acquisition costs of 28,000 euros, 29,000 euros remain for this group, or 29 euros per first-time buyer, before fixed costs that are not included. The calculation documents the breakdown of costs. It is neither a profit statement nor a forecast covering the entire customer lifetime.
Compare similar customer groups
Group customers into cohorts based on the date of their first valid purchase. For example, compare the first 180 days of the January group with the first 180 days of the February group. At the end of the year, the January cohort had more time to place further orders than the September group. A comparison of the cumulative totals to date would present this time advantage as a supposed difference in quality.
Keep other differences visible: acquisition source, product group, introductory discount and return rate. A small shopping basket of consumable products may, after several purchases, contribute differently to the business than a single large purchase. First, total the contributions per group and divide by the original number of customers. Using only repeat buyers as the denominator would exclude those who did not make a further purchase from the profitability analysis.
What Klaviyo’s CLV fields actually mean
The Official documentation on Predictive Analytics distinguishes between Historic CLV (historical order value, taking into account refunds and returns), Predicted CLV (expected expenditure over the next twelve months) and Total CLV (the sum of both figures). These revenue-related values do not include a complete individual cost analysis of your shop.
The forecast assumes, amongst other things, at least 500 customers with orders that have not been cancelled or refunded and have a positive value, an order connection, 180 days’ history, orders placed within the last 30 days, and some customers with at least three orders. Buyers are the key factor, not mere newsletter profiles. Additionally, check the actual metric used and value transfer. A missing forecast value does not automatically mean that the person is of no commercial value.
Treat expectations as scenarios
A forecast is more suitable for planning a customer group than an exact commitment regarding an individual person. In addition to a medium-case scenario, create a more conservative assumption regarding purchase frequency, shopping basket value and returns. Once the forecast period has elapsed, check how the observed group actually performed. A documented deviation is crucial; an assumption that is regularly amended without a comparison makes the model difficult to verify.
In a business forecast, the cost of capital and discounted contributions may also be relevant. You must construct this calculation independently and identify it as a model. To do this, do not count different time periods twice: contributions already recorded, a forecast for the next twelve months and a longer-term scenario are separate components. Rounding to the nearest euro does not eliminate the uncertainty of the assumptions.
How customer value can support email planning
Use this value to support informed group decisions. A frequent buyer may need a product explanation before ordering a complementary range. For an occasional buyer, a suitable reminder may suffice. A high CLV is not a justification for sending the same person more messages or larger discounts. Always check their interest, delivery criteria and frequency as well.
Klaviyo describes in the Guide to CLV segmentation how the available fields are used for group formation. Before implementation, determine why the content changes for this group. Subsequently evaluate the measure based on contribution, repeat purchases, unsubscribes and complaints. Higher attributed revenue alone does not prove additional economic value.
Check data and calculations before use
- Reconcile test orders, refunds and cancellations with the shop report.
- Treat net values, currencies and discounts consistently throughout.
- Check for multiple profiles of the same person and possible duplicate orders.
- Record the observation period and cost allocation in writing.
- Compare cohorts with the same maturity and a complete denominator.
- Compare forecast figures with actual results at a later date.
Start with a small, manually verifiable sample. If the individual values are correct, you can expand the group analysis. Also document any costs not included and missing data. This ensures it remains clear which decisions the metric can support and which require further scrutiny.
Sources and further documentation
Product documentation and primary sources relating to the steps described. Editorial source date: 5 October 2026.